Macromegas #48 - Macroeconomics 101 via Capital & Productivity
Macroeconomics 101 via Capital & Productivity
Hello Friends,
And happy Saturday!
Having majored in economics, I have always lamented about the way it is taught, especially macroeconomics: starting with Keynesian and inflation models is too abstract.
The first book I read that really anchored capital, labour, and productivity into the reality of history was Piketty’s Capital in the Twenty-First Century.
Even though I do not agree with most of Piketty’s ideology, I could not but admire his work as far as this book was concerned.
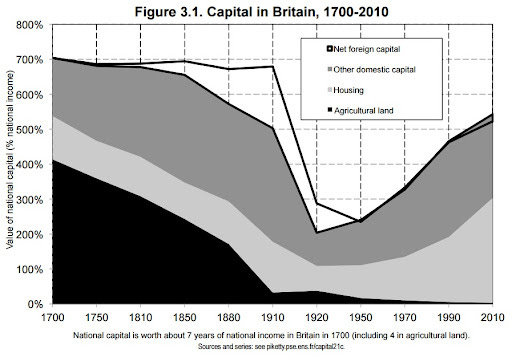
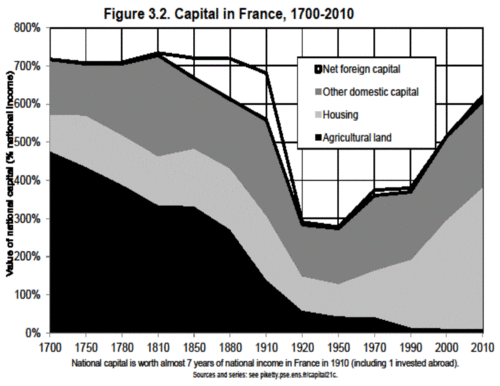
One of his most insightful analyses consists of charts such as these ones:
His “value of national capital / GDP” ratio is an eye-opener.
It is the basis for understanding yield, social mobility, and productivity.
I was delighted to discover that McKinsey’s MGI was copying this approach in their new report: The rise and rise of the global balance sheet - How productively are we using our wealth?
Let me put it this way: if I had to teach a Macro 101 course, I would most likely use this report as sole material. Any addition would be noise.
The full report is nearly 200-page long, but definitely worth a read (or several!) if you are interested in understanding the basics of how our economy works.
I highlighted the best parts for you below:
Real estate accounts for two-thirds of real assets.
Among the four sectors of the economy, households control 95 percent of net worth:
A national balance sheet is the sum of the individual balance sheets of four sectors: households, governments, corporations, and financial institutions including central banks. Size and composition vary significantly
Households control the bulk of net worth, governments the small remainder.
Because non-financial and financial corporations have equity as a liability that largely corresponds to their net asset holdings, they do not have material net worth.
Each sector owns a mix of assets and owes liabilities according to its function in the total economy.
Germany, Mexico, and Sweden are at the lower end of household net worth, due to lower real estate and equity holdings - NOTE: this is Piketty’s approach 2.0.
Household real estate accounted for almost half of global wealth growth, and corporate assets added a quarter.
The next and last 5 insights below are perfectly in line with Piketty’s core thesis: a higher “value of national capital / GDP” implies lower capital productivity (everything else remaining equal). The share of income returning to capital (vs. labor) is an important force in the evolution of this ratio.
If net worth were to revert to its historical average relative to GDP, it would decline by one-third on average.
Capital creates returns and supports productivity and wages.
Capital productivity is highest in Canada, the United Kingdom, and the United States, while operating returns are highest in Mexico.
Return differences across countries are sustained even when adjusting for industry mix, asset mix, and differences in real estate yields.
Differences in asset stock and portfolio mix explain most of the difference in labor share of income across countries.
McKinsey shares many further insights on real estate valuations and productivity metrics, but I can’t share everything here and still call it highlighting.
If you are interested in discussing further, please comment below.
Thanks for reading, and have a productive weekend,
V


